
What you will find here
Explore the MLPro Project Dashboard in Power BI for reviewing costs, phases, risks and issues, with filters for individual projects.
We know that in a company, project information is directed to various hierarchical levels and, each of them, there is a specific need in relation to the information that should be transmitted.
In this article, we will bring a summary of the Dashboard of Projects, developed with Microsoft Power BI, its respective characteristics and the benefits of its use.
01Project Dashboard
The Project Dashboard allows the use of search filters to facilitate the visualization of information from a specific project.
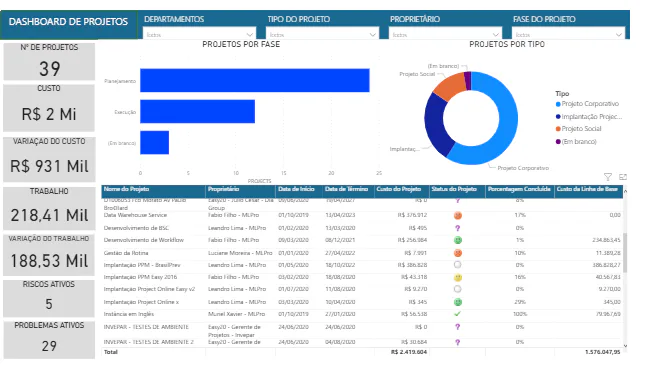
In this report it is possible to filter the information by department, project type, owner and project phase.
By clicking on the graph, we can view the project specific information. In the example below, we click on the "execution" phase bar and so automatically, the graph displays only the requested phase information.
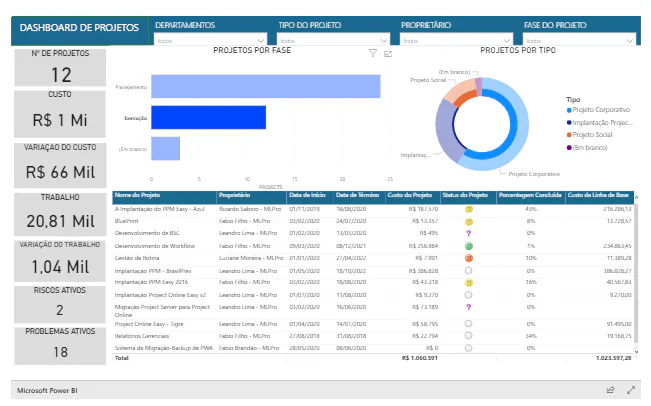
In an agile way it is possible to verify the information about the amount of projects, cost, cost variation, labor cost, work variation, risks and active problems. The graph allows you to view the information by phase and projects by type.
With the use of Microsoft Power BI, the project dashboard report includes relevant project information, facilitating data analysis and decision-making.
To learn more about the Project Dashboard, Microsoft Power BI, Microsoft Project Online or how to optimize your company's project management, please contact us.
Original content from the MLPro editorial library, fully preserved and translated for the English website.