
What you will find here
See how Power BI reports support project and portfolio analysis using the Project Online examples in this MLPro article.

When we talk about project management, we have a multitude of information that needs to be analyzed so that managers are able to make the best decisions during the project.
However, with the volume of information we currently have access to, we increasingly need to have an agile way to analyze this information and evaluate their impacts on the management of our projects.
In this article, we will present some features of the Portfolio Dashboard report developed in Power BI by MLPro and the main benefits of its use in managing your company's projects.
Before we talk about Project Management with Power BI and the portfolio dashboard report, let's start by commenting on Microsoft Project Online.
01Microsoft Project Online
The Microsoft Project allows the complete management of your company's projects through the planning of your schedule, task control, allocation, resource capacity analysis, project baseline control, and project “native” reporting.
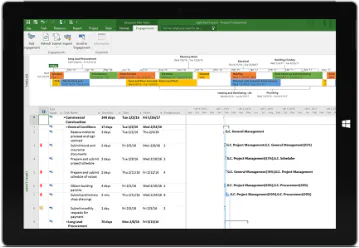
As much as the Project's native reports allow some parameterizations, depending on the characteristics of your projects, perhaps your company needs personalized and customized information.
To meet this need, Microsoft recommends using Microsoft Power BI which allows a more refined evaluation of the information of your projects.
02What is Microsoft Power BI?
The Power BI is a Business Intelligence tool developed by Microsoft that enables the creation of dashboards and dynamic reports allowing simple and intuitive analysis to improve the process of analysis and decision making.
With the use of Power BI, it is possible to perform an analysis of the project data, allowing the complete visualization of its indicators and thus having a 360 degree analysis of its projects.
03Controlling Project Portfolio with Power BI
To facilitate the visualization of the company's project portfolio information, MLPro has developed a report in Power BI that allows more effective management of your company's projects.
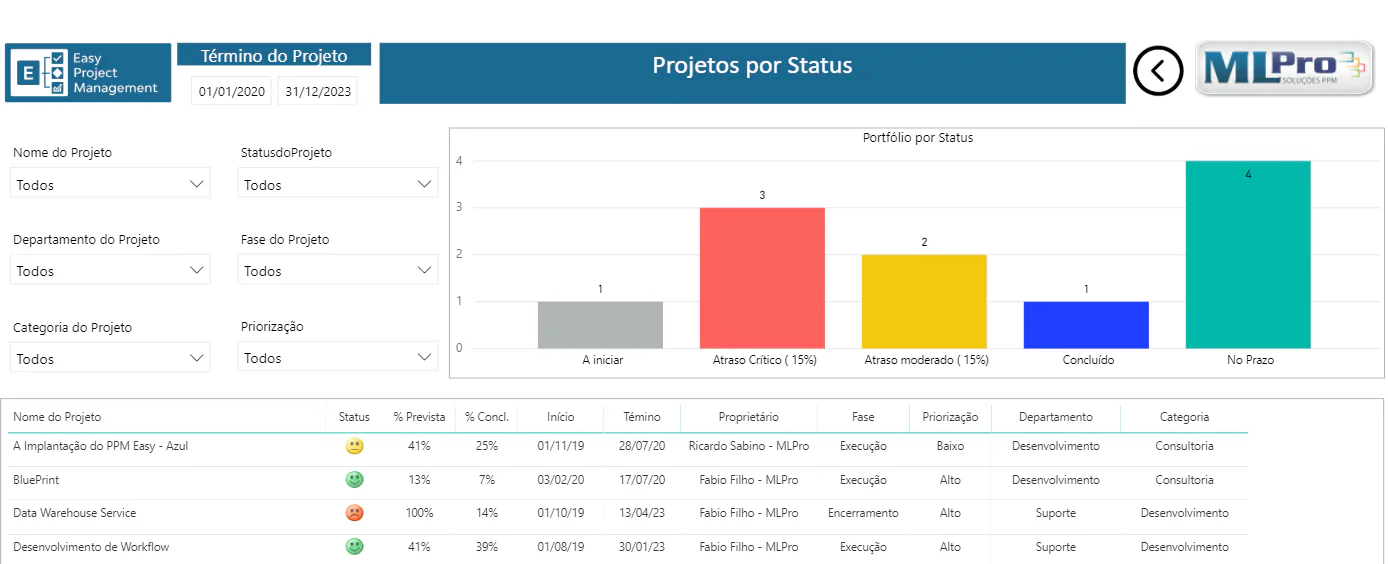
In this report, it is possible to filter projects by department, project manager, project type and project end date.
In addition to these filters, the MLPro report shows the following graphs:
When analyzing the graph of Portfolio by Status we have the possibility to follow the status of each project according to its respective implementation phase.
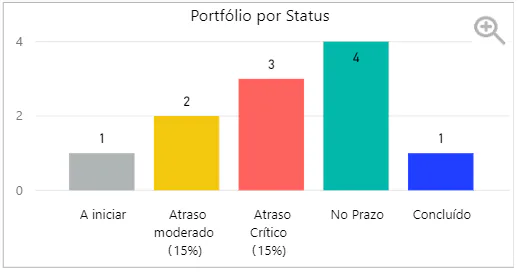
With the visualization of this information, the project manager is able to monitor in a practical and agile way the situation of the company's projects and thus take corrective actions if necessary.
This report displays the status of the Status Portfolio using the following search filters:
- Project name;
- Project Department;
- Project Phase;
- Project department;
- Prioritisation;
In addition to these filters, you can follow the Status of each project, which percentage is expected, the percentage completed of each project, the start date, the end date and the owner of the project.
The graphics bring the information from all the projects but, if the project manager wants to verify what the project is for a specific phase just click on the chart according to the desired status and only these projects will be displayed.
With easy and rapid access to this information, it is possible to analyze the situation of each project of your company and trigger the responsible to take corrective actions if necessary.
To learn more about Microsoft Power BI, Microsoft Project Online or how to optimize your company's project management, please contact us.
Original content from the MLPro editorial library, fully preserved and translated for the English website.