
What you will find here
Learn how to add Power BI reports to PowerPoint presentations using the integration described in this walkthrough.
Microsoft has finally made available the option to add direct Power BI reports to Power Point presentations!
Before this option was so expected by users, it was only possible to get the images from the reports. Soon, the data always got outdated and the images needed to be replaced.
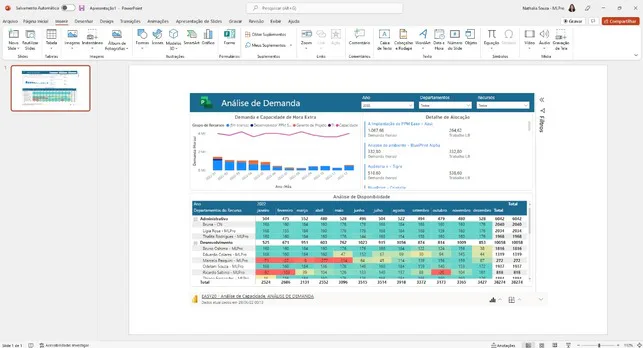
Now, in addition to containing the information from the reports always updated, integration allows the user to interact with the report in the same way it is in Power BI! In other words, you can use all the filters and viewing options.
01How to add Power BI to Power Point
It's very simple! Follow step by step:
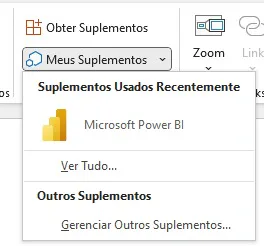
- In Power Point, within the “Insert” tab, click “Get Supplements”.
- After this, a screen will appear with several options to add to your presentation. Add Power BI.
- A screen with the option to add a link will open on your slide. Enter into space the link of the desired Power BI page.
- Ready! Your graph will be inserted, with the possibility of interaction!

Note: After performing this action for the first time, Power BI will already be in “My Supplements”. That way you can add even faster.
Now your performances will be much more complete! The data from your graphics on the slides will always be real without needing maintenance, as well as being able to meet requests for viewing information specific to those who are following the presentation.
Original content from the MLPro editorial library, fully preserved and translated for the English website.