
Introduction
The monthly portfolio meeting starts and the PMO presents numbers that look solid. The question almost nobody asks is simple: did anyone validate this data first? When the answer is no, the decision rests on fragile information, and the risk spreads across the whole portfolio.
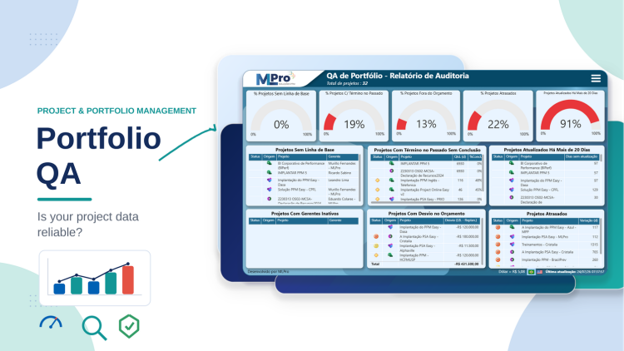
Portfolio QA answers exactly that question. It is a Power BI report that checks the quality of the information logged in the projects and shows, on a single screen, where the non-conformities are. The manager fixes the gaps before the meeting, not after it.
In this conceptual article, you will learn what Portfolio QA is, how it differs from Project QA and which indicators it tracks. You will also see how the report details each gap by project and owner, and how to turn this check into a simple governance routine.
It helps to separate two levels. QA, short for Quality Assurance, is the discipline of quality management, here applied to the quality of project information, not to software. The Portfolio QA report is a specific resource, delivered in Power BI within the PSA Easy solution, that turns this discipline into indicators and details.
Summary table
| Stage | Goal | Application in the tool |
|---|---|---|
| Surface non-conformities | Measure portfolio data quality | Five indicators in the Power BI report |
| Detail and assign ownership | Identify project and owner of each gap | Detail tables by project and owner |
| Close the loop | Fix before the portfolio meeting | Report reprocessing and a compliance target |
Prefer a visual walkthrough? Watch the demonstration of the topic in practice.
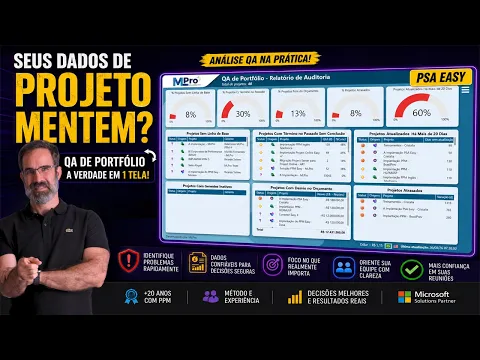 Play video: Portfolio QA demonstration in PSA Easy
01. What Portfolio QA is
Portfolio QA is the report that assesses whether the information logged in the projects is reliable enough to support decisions. Instead of looking at the schedule or cost of a single project, it observes the whole portfolio and highlights where data is incomplete, outdated or inconsistent.
The focus is the quality of information, not the quality of software. Because of workload, teams do not always update their entries on time. That gap creates inconsistency and undermines control. The report exposes it objectively, so it can be handled before it turns into a decision.
02. Project QA and Portfolio QA: the difference
Both reports share the same quality assurance logic but have different scopes. Project QA looks inside a single project and helps the manager correct their own entries. Portfolio QA consolidates this reading for the PMO, which then sees the health of every project on a single view.
In practice, the reports complement each other. The manager uses Project QA day to day, and the PMO uses Portfolio QA to track compliance across the set. Both belong to the same portfolio and project reporting package in Power BI within the PSA Easy solution.
03. The five indicators of the report
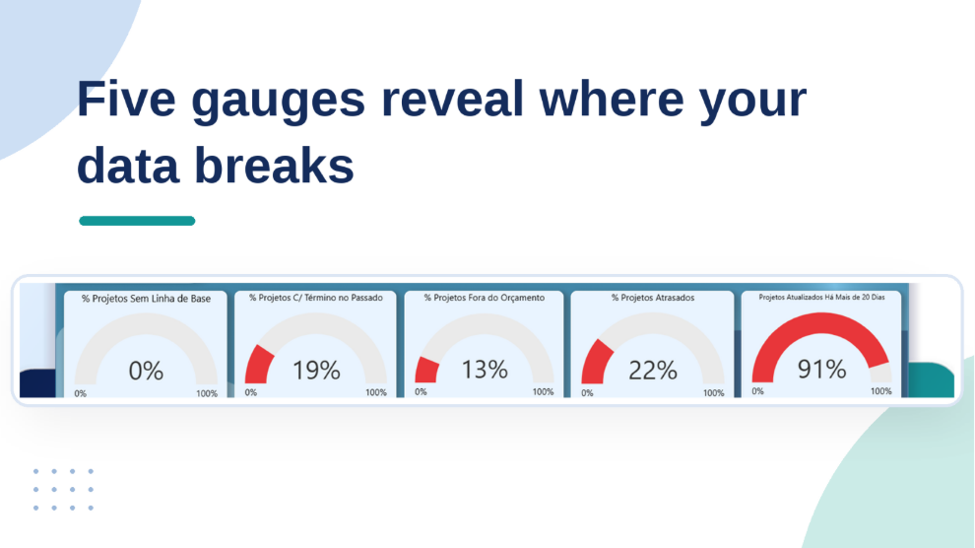
The report concentrates the reading on five graphical indicators. Each one measures a type of non-conformity and shows its practical consequence for the portfolio. The list below summarizes what each indicator tracks.
- Projects without a baseline: without a saved baseline there is no reference to measure variance, so the project cannot be assessed.
- Projects past their finish date with no completion: they are overdue yet still open, which pollutes the portfolio and distorts the capacity reading.
- Outdated projects: they have no recent publication. The day threshold is configurable, according to each company policy.
- Projects over budget: they flag financial overrun inside the portfolio, requiring attention before the numbers are consolidated.
- Delayed projects: they provide the consolidated view of schedule adherence across the portfolio.
The baseline mentioned in the first indicator is a snapshot of the original plan, used as a reference to compare planned against actual over the project in Microsoft Project.
04. Detail by project and owner
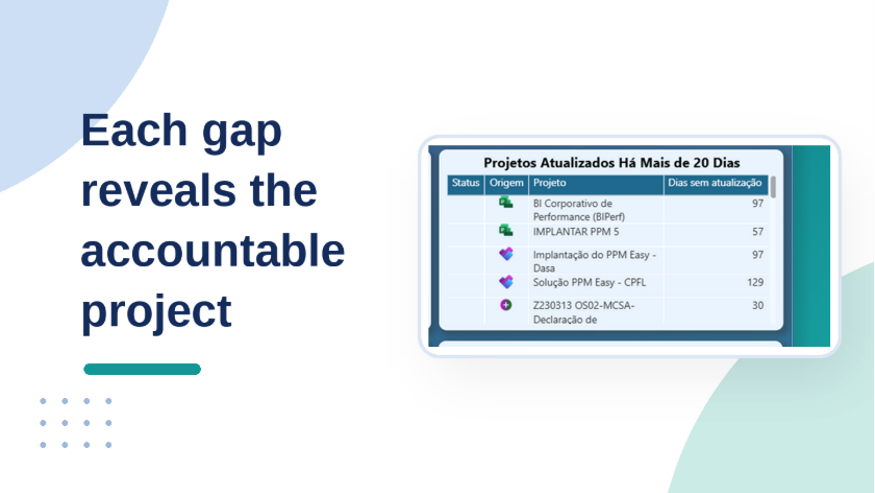
Beyond the chart, the report details each non-conformity. For projects without a baseline, it shows the project name and the owner. For projects overdue with no completion, it shows the name, the number of days, the owner and the completion percentage.
For outdated projects, the report presents the name, the owner and the number of days since the last publication. This detail exists to guide. The goal is to let the PMO identify the owner and reinforce good practices, without turning the analysis into a witch hunt.
The report also checks projects with an inactive owner, a common case when an employee leaves and remains the formal owner. This check keeps projects from losing a real owner and helps keep the database current.
05. Turning QA into a governance routine
The report delivers the most value when it becomes a routine rather than a one-off check. The recommendation is simple: run Portfolio QA before every monthly meeting, never after. That way corrections happen while they still influence the decision.
When to adopt it
The report pays off most in portfolios with many projects and several managers, where data inconsistency is hard to see by hand. In those cases, the consolidated reading saves time and reduces the risk of decisions based on fragile numbers.
What to assess first and which cautions to consider
- Define the report parameters, such as the number of days that flags a project as outdated.
- Set a compliance target by area or by manager and track the percentage month over month.
- Treat the detail as individual guidance, not punishment, to preserve team adoption.
- Use the report as objective evidence in internal and external audits.
Quick FAQ
What does QA mean in Portfolio QA?
QA stands for Quality Assurance. In the portfolio context, the focus is the quality of the information logged in the projects, not the quality of a software product.
What is the difference between Project QA and Portfolio QA?
Project QA focuses on one project and supports the manager. Portfolio QA consolidates the reading for the PMO, with the compliance of all projects on a single screen.
Does the report show who is responsible for each gap?
Yes. The detail brings the project and the owner of each non-conformity. The purpose is to guide the owner on good practices, not to expose people.
How often should I run Portfolio QA?
Run it before every monthly portfolio meeting, and reprocess after the corrections, to present the compliance percentage alongside the numbers.
About MLPro
MLPro specializes in Microsoft PPM solutions, with more than 20 years in the Microsoft ecosystem. We help PMOs and project teams standardize processes, gain visibility and decide with reliable data, using Microsoft Project, Microsoft Planner, Planner Premium, Power Platform and the PSA Easy solution.