
01Introduction
Almost every company can list the risks in its projects. Few can say, in currency, how much those risks cost the portfolio. The gap looks small, but it changes the conversation with leadership: knowing that a risk exists is different from knowing how much it could take from the budget if it happens.
The reason is familiar. In most tools, risks, opportunities, changes and issues live on separate screens and are handled qualitatively, with high, medium and low labels. What is missing is a financial number that ties everything together and answers the central question: what is the portfolio's total exposure, added up?
That is the gap the ROCI+ analysis aims to fill. It brings together four types of portfolio offender, converts each one into financial impact, and shows the total exposure on a single dashboard. Decisions stop relying on perception and gain a clear value, comparable across projects and owners.
In this article you will understand the concept behind the ROCI+ analysis, the difference between total exposure and net sum, the role of opportunities in the calculation, and how to use this reading to prioritize. The goal is practical: turning risk control into a money-driven decision.
First: the risk process and the tool feature are not the same
It helps to separate two planes that are often confused. On one side is risk management as a process, an established discipline that identifies, analyzes, plans responses to and monitors uncertainty. According to Microsoft, risk combines the impact of an event and the probability that it occurs, and it can be negative or positive (opportunities).
On the other side is the tool feature. The ROCI+ analysis is a PSA Easy report that reads the items already registered and consolidates them into value. It does not replace the risk process: it supports analysis and prioritization with a financial layer.
Summary table: from identification to prioritization
| Step | Objective | In the tool |
|---|---|---|
| Identify | Register risks, opportunities, changes and issues for each project. | Centralized risk and issue lists in PSA Easy, with type and owner. |
| Quantify | Assign cost and probability to each item. | Cost, probability and impact fields on each item. |
| Consolidate | Add the four types into one financial impact. | ROCI+ analysis report, reading items across all projects. |
| Prioritize | Act first where exposure is highest. | Filters by type, project and owner in the report. |
Prefer a visual walkthrough? Watch the ROCI+ analysis demonstration before continuing.
 Play video: ROCI+ analysis demonstration
01. The problem of four separate controls
In many PMOs, each type of offender lives in a different place. Risks sit in one list, issues in another, changes in a spreadsheet, and opportunities almost never appear. Each control uses its own qualitative scale, and no one adds up the money at month end.
The result is predictable. When leadership asks for the portfolio's total exposure, there is no single answer, only four partial snapshots. That is where cost slips away, because what is not measured in currency rarely enters the investment decision.
02. What the ROCI+ analysis is
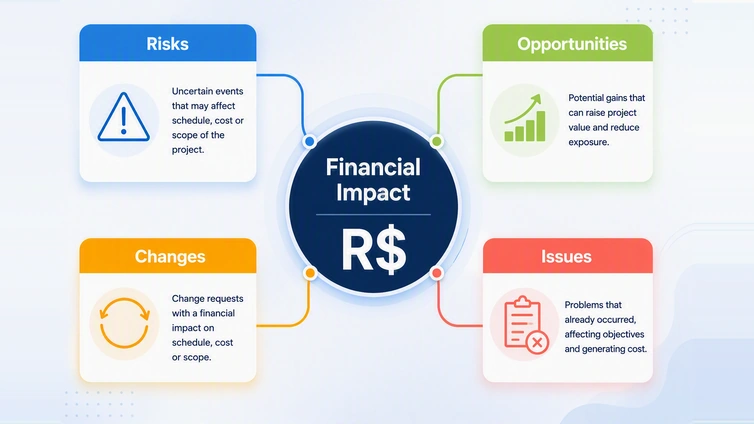
The ROCI+ label organizes the four types of portfolio offender and signals their consolidation. Each letter is a category that can affect schedule, cost or scope, and the plus sign marks the sum into a single decision number.
- R, Risks: uncertain events that, if they occur, impact schedule, cost or scope.
- O, Opportunities: potential gains; they enter with a negative sign because they reduce exposure.
- C, Changes: change requests with an associated financial impact.
- I, Issues: problems that already materialized and generate real cost.
The + is the heart of the method: instead of four isolated controls, one financial indicator for leadership, comparable across areas, projects and owners.
03. From qualitative item to financial impact
The turning point is putting a price on each item. When registering a risk, alongside probability and impact, you enter the cost if it happens. An issue that already occurred enters at its real cost; a change, at its estimated value. Without that figure, the item stays just a label.
For risks, the calculation follows the classic logic: cost if it occurs, times probability. A R$ 100k risk with a 10% chance enters as R$ 10k of expected impact. This is the same basis Microsoft recommends, defining risk as impact times probability, now expressed in money.
04. Financial Impact and Consolidated Impact: the two numbers that matter
The analysis shows two indicators that answer different questions and should not be confused. One reflects the most likely scenario; the other, the total scenario. Reading both together avoids both over-optimism and needless alarm.
- Financial Impact: the net sum of the four types, already weighted by risk probability and reduced by opportunities. It is the most likely exposure.
- Consolidated Impact: the total exposure, adding items without weighting by probability. It is the worst case, useful as a reference ceiling.
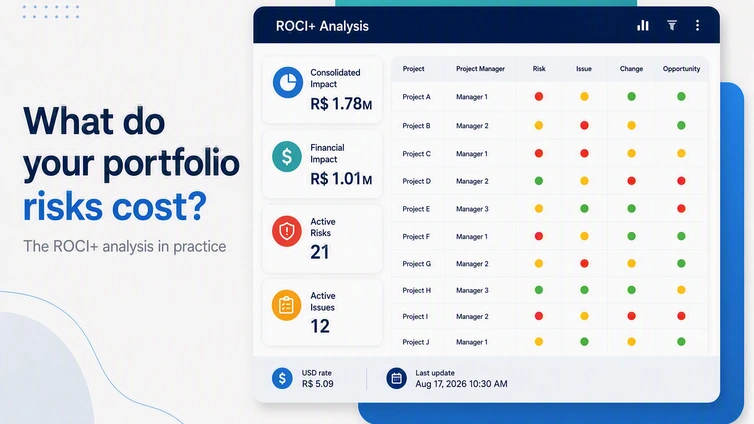
The ratio between the two becomes a percentage showing how much the likely exposure represents of the total ceiling. In the demonstration data, Consolidated Impact was about R$ 1.78 million and Financial Impact about R$ 1.01 million, roughly 56.69%. These figures come from a test environment and are shown to explain the reading, not as client data.
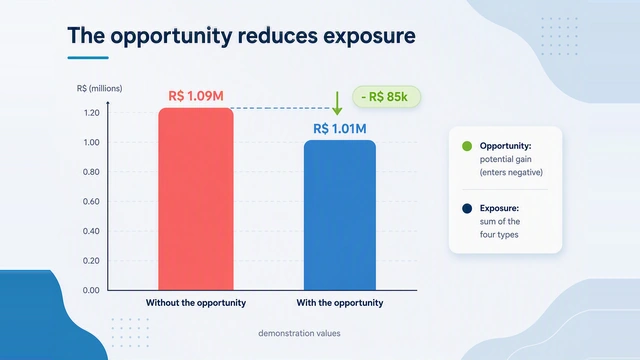
By type, the same demonstration environment distributed the total like this: risk about R$ 567k, issue about R$ 479k, change about R$ 48k and opportunity about R$ 85k negative.
05. Opportunities: the value that reduces exposure
The opportunity is the most overlooked of the four items, and the most interesting in the math. As a potential gain, it enters with a negative sign and lowers total exposure. Failing to register it artificially inflates the perceived risk.
In practice, this changes how a project or an owner reads out. Someone who registers many opportunities may show lower, or even negative, exposure, because expected gains offset part of the risks and issues. The calculation reflects both sides of uncertainty, not only the bad one.
06. From total exposure to prioritization
A single exposure number is only useful if it drives action. The report lets you drill from the total to the detail, showing which projects and which owners concentrate the largest financial impact. They deserve attention first, because they account for most of the bill.
Filters support this reading. You can isolate only risks, only issues or a single project and see the matching exposure. For international environments, the report can also convert values to US dollars using the daily rate, keeping the same comparison basis across countries.
Using the ROCI+ analysis in three steps
- Register with value: record risks, opportunities, changes and issues with their financial impact in each project.
- Consolidate: use the ROCI+ analysis to add the four types and see total portfolio exposure.
- Prioritize: tackle first the projects and owners that concentrate the largest impact.
When to adopt it and what to check first
The ROCI+ analysis matters most in organizations already running many projects at once that need to justify investment decisions to leadership. Before adopting it, a few points deserve attention so the number is reliable.
- Registration maturity: the indicator is only as good as the discipline in recording items with value.
- Cost criteria: define how to estimate the cost of each type so projects use the same ruler.
- Probability governance: standardize how risk probability is assigned to avoid distortions.
- Joint reading: always follow both indicators to avoid confusing the likely scenario with the total one.
08Frequently asked questions
What does ROCI+ mean?
ROCI+ brings together risks, opportunities, changes and issues from the portfolio. The plus sign marks the consolidation of these four types into a single financial impact, instead of keeping them in separate controls.
What is the difference between Financial Impact and Consolidated Impact?
Financial Impact is the net sum, already weighted by risk probability and reduced by opportunities. Consolidated Impact is total exposure, without weighting by probability. One is the likely scenario, the other is the ceiling.
Is a risk's cost a guaranteed amount?
No. For risks, expected impact is the cost if the event occurs, times its probability. It is an exposure estimate, not a certain expense. Issues that already occurred, by contrast, enter at their real cost.
How does an opportunity enter the calculation?
An opportunity is a potential gain and enters with a negative sign, reducing total exposure. Registering opportunities is as important as registering risks: without them, the math skews to the negative side.
Do I need Power BI to use the ROCI+ analysis?
The ROCI+ analysis is delivered as a PSA Easy report within the Microsoft ecosystem. Access follows the client's Microsoft and Power BI licensing.
09Continue your journey
10About MLPro
MLPro specializes in project portfolio management (PPM) within the Microsoft ecosystem, with over 20 years of experience. We apply the ROCI+ analysis inside PSA Easy, with risk and cost dashboards ready for leadership, and support PMOs in transforming project, program and portfolio management.
- Website: www.mlpro.com/en
- WhatsApp: wa.me/5511932072349
Book a demo with MLPro's specialists and see how to implement the ROCI+ analysis in your environment with PSA Easy.
Book with Microsoft Bookings →Original content from the MLPro editorial library, fully preserved and translated for the English website.