
Reports Without Power BI: Fewer Licenses, More Power
Your portfolio review starts in ten minutes. The director wants to know which projects need attention, but the dashboard still shows the last scheduled refresh. Part of the team doesn't have a license to open the report. And getting the view into a PDF for the meeting is anything but simple.
This is a familiar situation for PMOs that rely on Power BI just to view management indicators. It's a robust tool, but licensing, refresh cycles and export add friction for people who simply need to check the numbers and act.
MLPro has built a reporting technology that removes the need for a Power BI license to view the reports created with it. The first concrete example is PSA Easy advanced reports.
In this article, you'll see what changes in refresh, export and navigation, which reports are featured in the demo, and how this technology can be applied to other needs in your organization.
Prefer to see it in action? Watch the full demo.
Fewer licenses: what changes when viewing reports
With PSA Easy advanced reports, users don't need a Power BI license to view reports built with MLPro's technology.
That doesn't mean the entire solution is license-free. Requirements for PSA Easy, the Microsoft platform and each customer's environment still apply. The benefit is not having to add a Power BI license just to view these reports.
Power BI also remains part of MLPro's offering. The PSA Easy Power BI reports are still available, and the right choice depends on each organization's scenario.
Learned from Power BI, redesigned for daily work
Advanced reports grew out of MLPro's experience with Power BI reports. What worked well was kept, and what caused friction was redesigned.
On-screen refresh
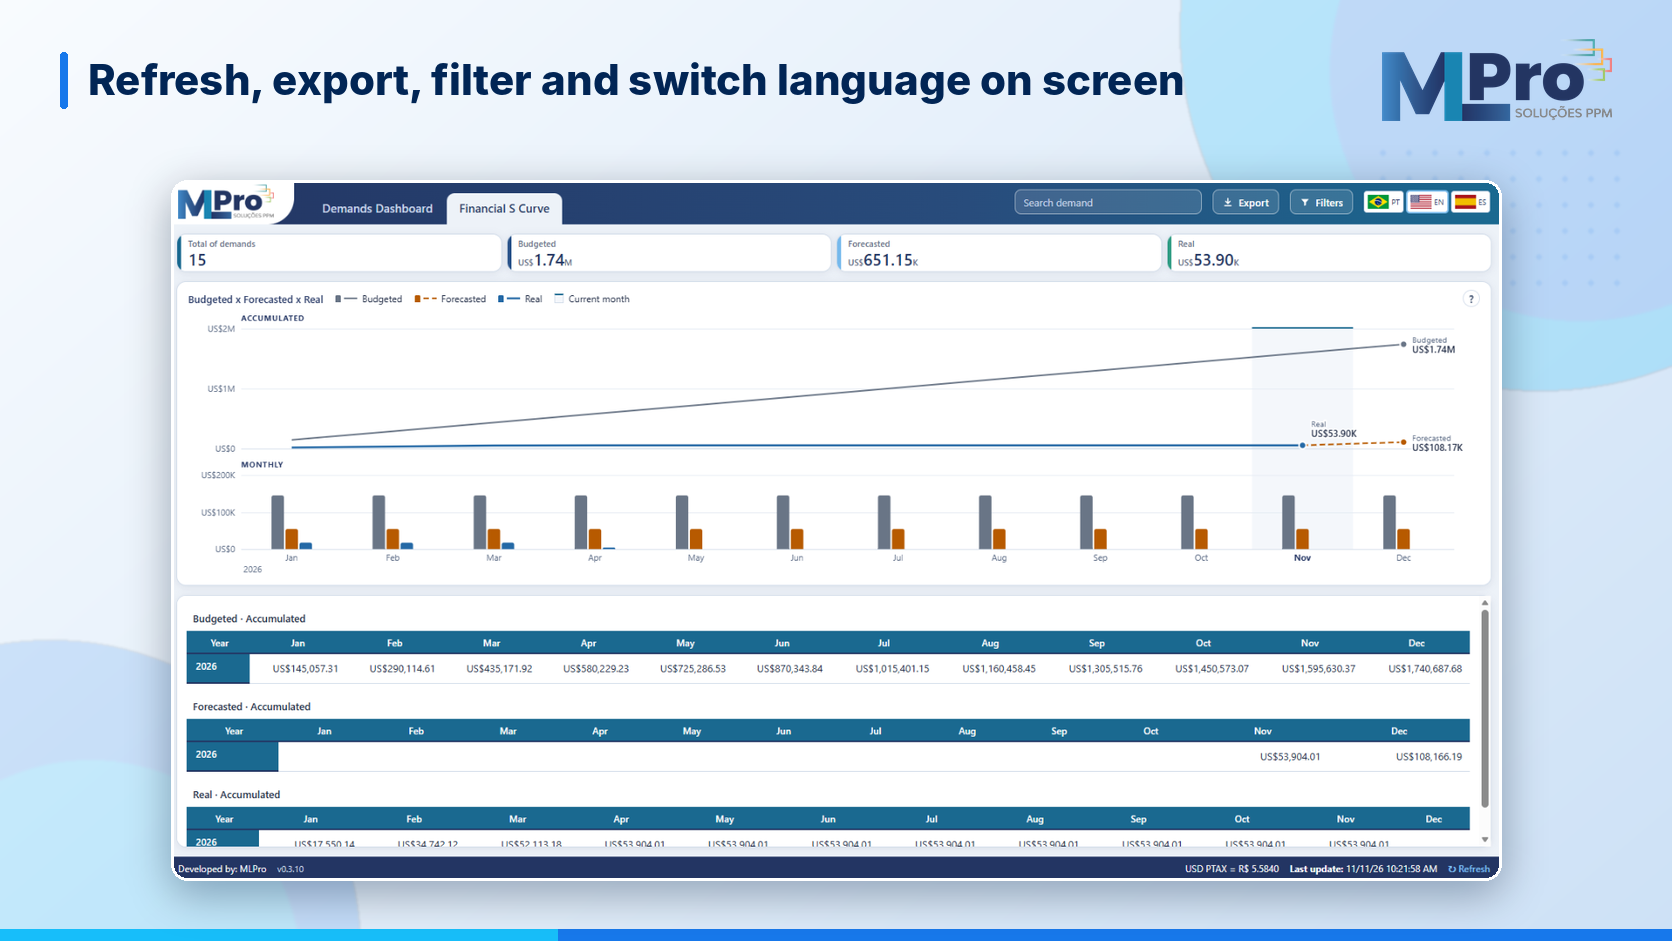
Each report shows when its data was generated. When you click refresh, the query runs again at that moment, taking into account what changed since the last refresh.
In Power BI, Import mode semantic models depend on source data refreshes, usually scheduled and subject to limits set by Microsoft according to the license. With advanced reports, users request a new refresh right on screen.
Export to PDF and Excel
Export was one of the most common complaints. Now views can be exported to a print-ready PDF, with charts arranged in sequence.
Working views can also be exported to Excel. The table is deliberately simple, because the goal is to work with the data.
Navigation designed for everyday use
In the demonstrated version, you can:
- see active filters and clear them with one click;
- adjust column widths and reset them;
- return to the last report you opened, saved in your history;
- use help icons that explain status indicators, symbols and calculation rules.
Portuguese, English and Spanish
The reports were built to be multilingual. The interface is available in Portuguese, English and Spanish, and the same engine supports adding other languages.
More power: what the reports show in practice
The demo covers some of the available reports. Others will be featured in upcoming content.
Portfolio and data quality
The portfolio report shows, for example, how many projects have no baseline. Clicking the indicator filters the view.
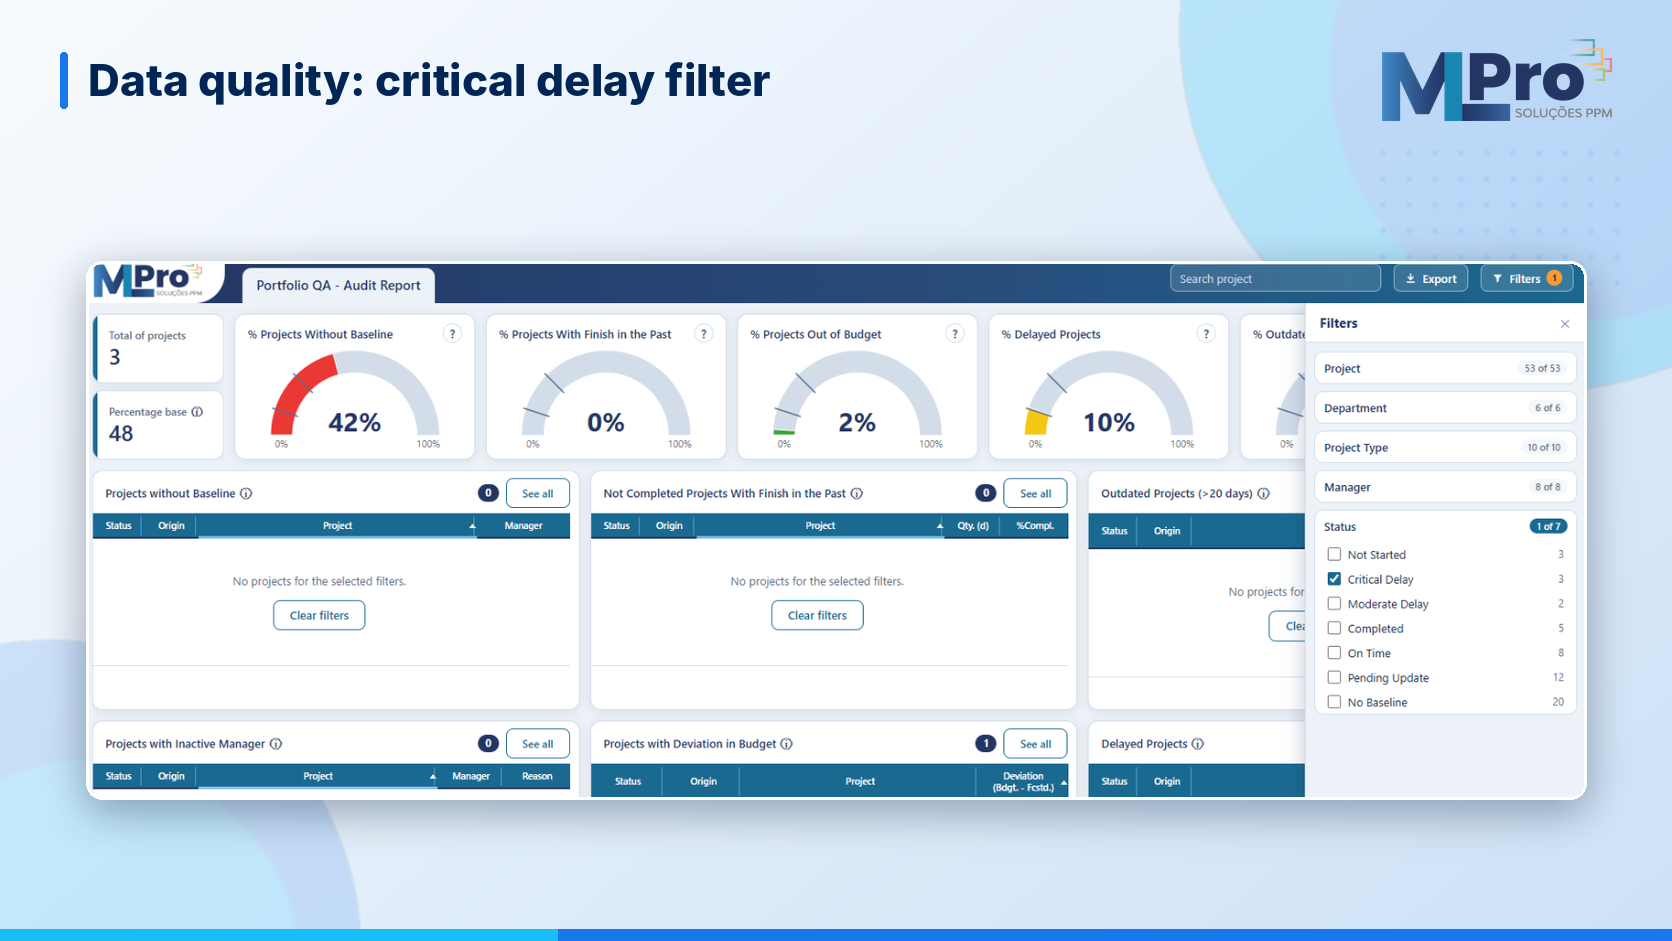
The Quality Assurance report brings together delayed projects and projects without a baseline. The status filter lets you isolate, for example, the projects with critical delay.
Demand prioritization matrix
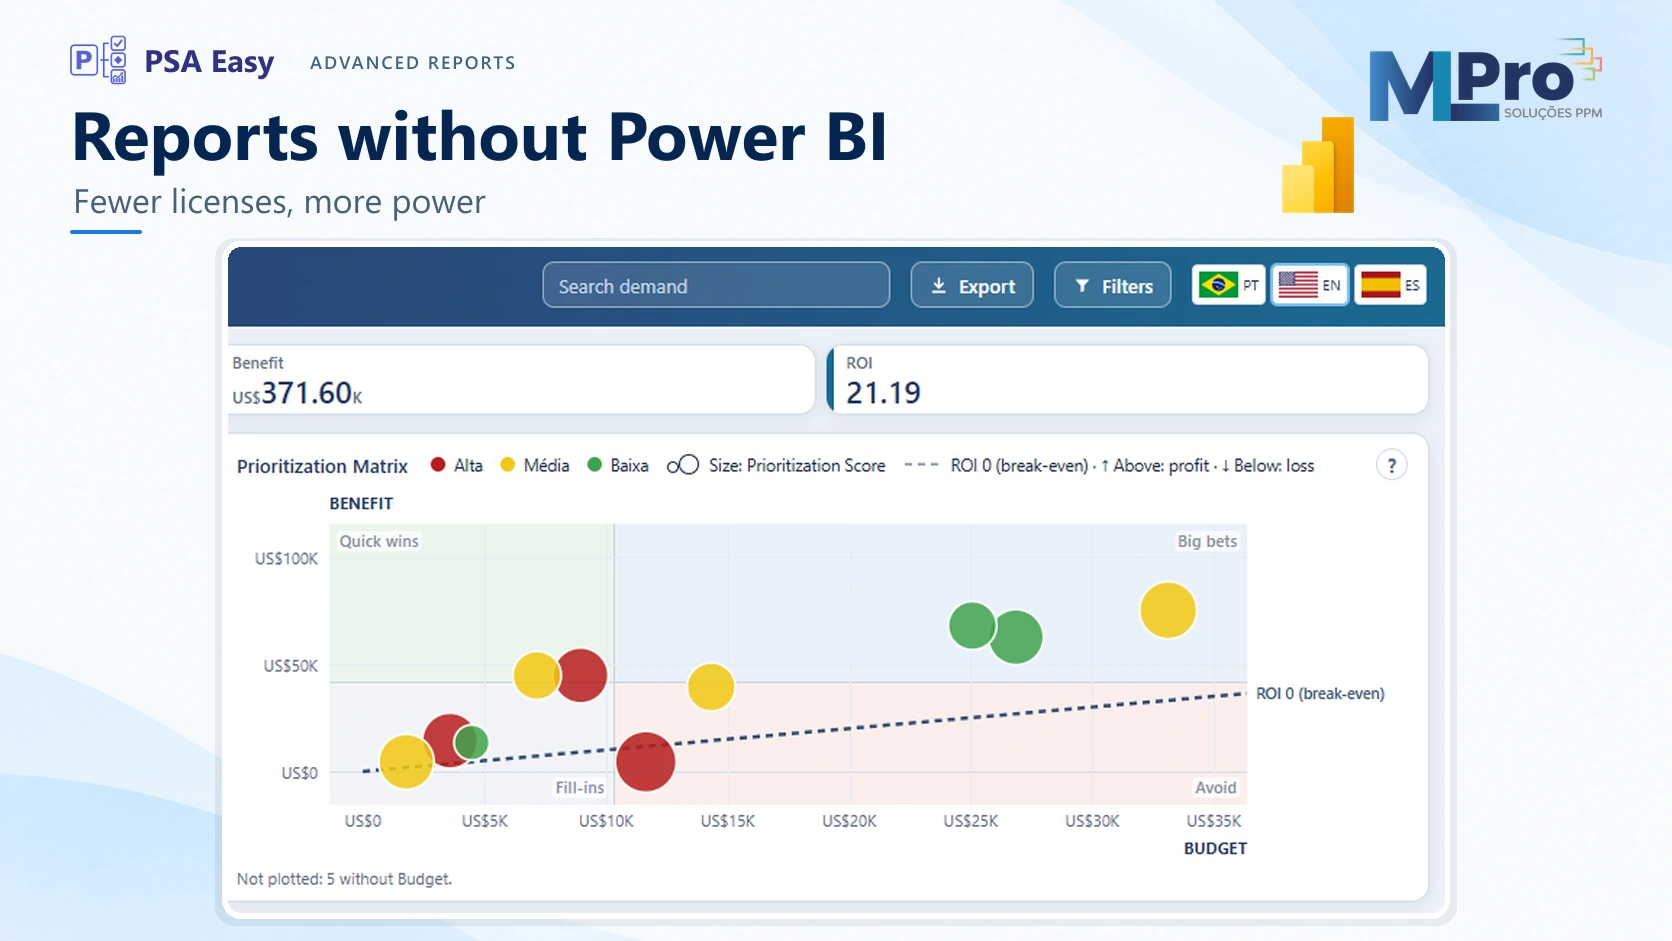
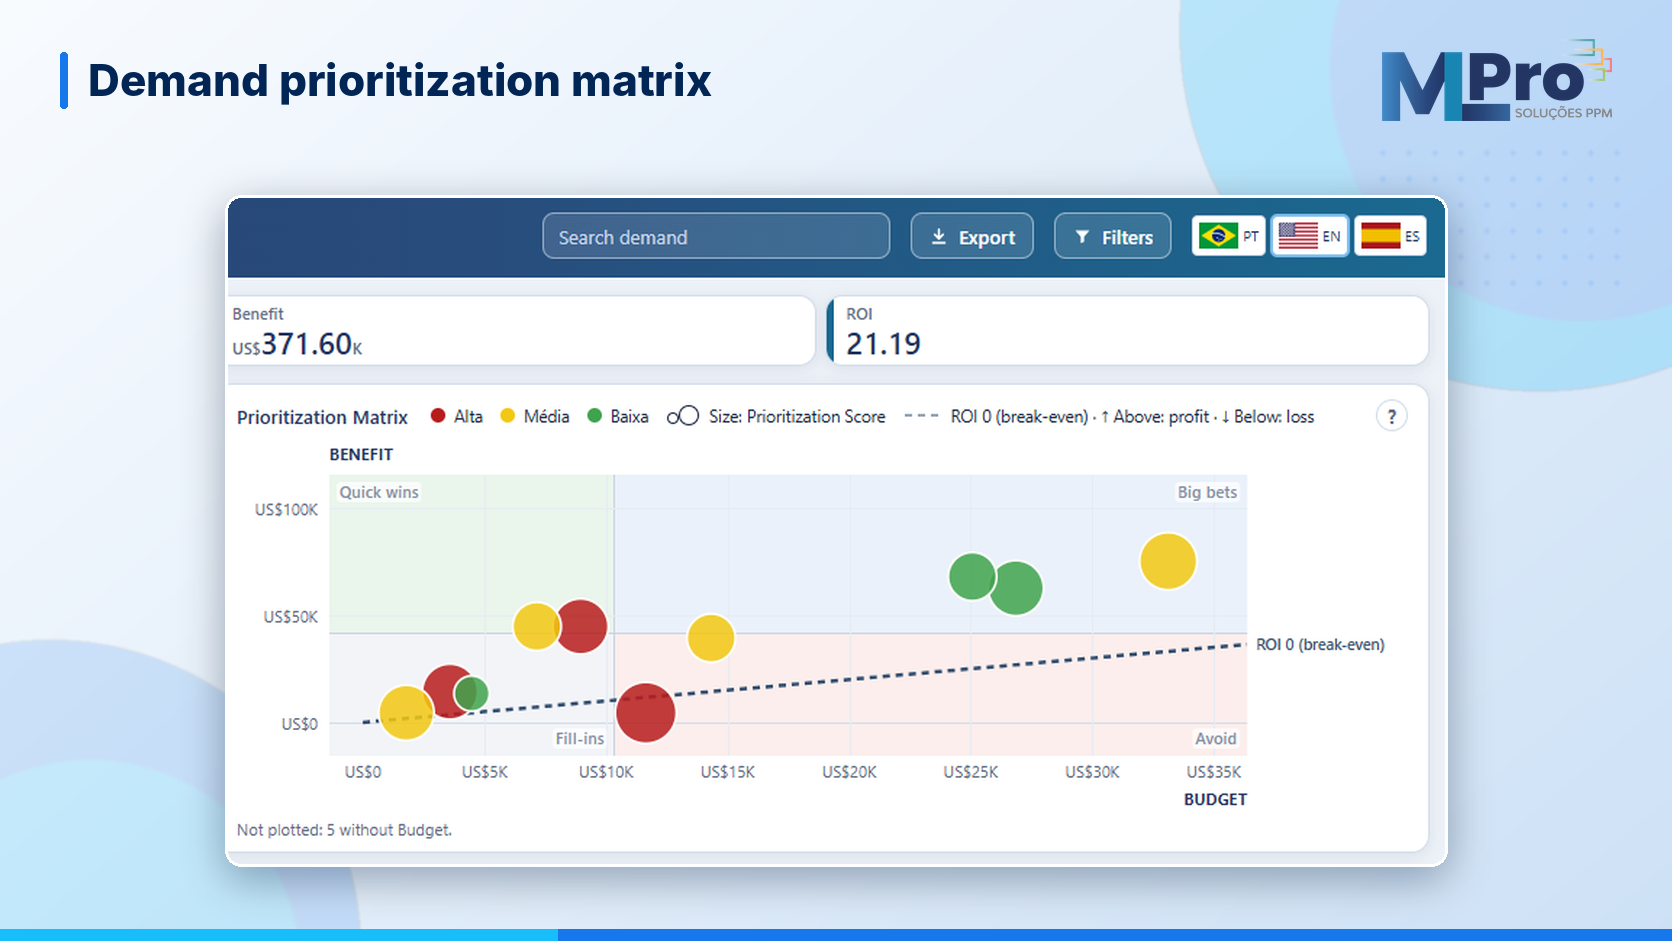
Demands are plotted on a benefit versus budget matrix with four quadrants. Quick wins combine high benefit with a smaller budget.
A zero-ROI line separates demands whose benefit exceeds their cost from those below it. You can filter by year, type or criticality, select an outlier, open the project and edit it straight from the chart.
Project WBS
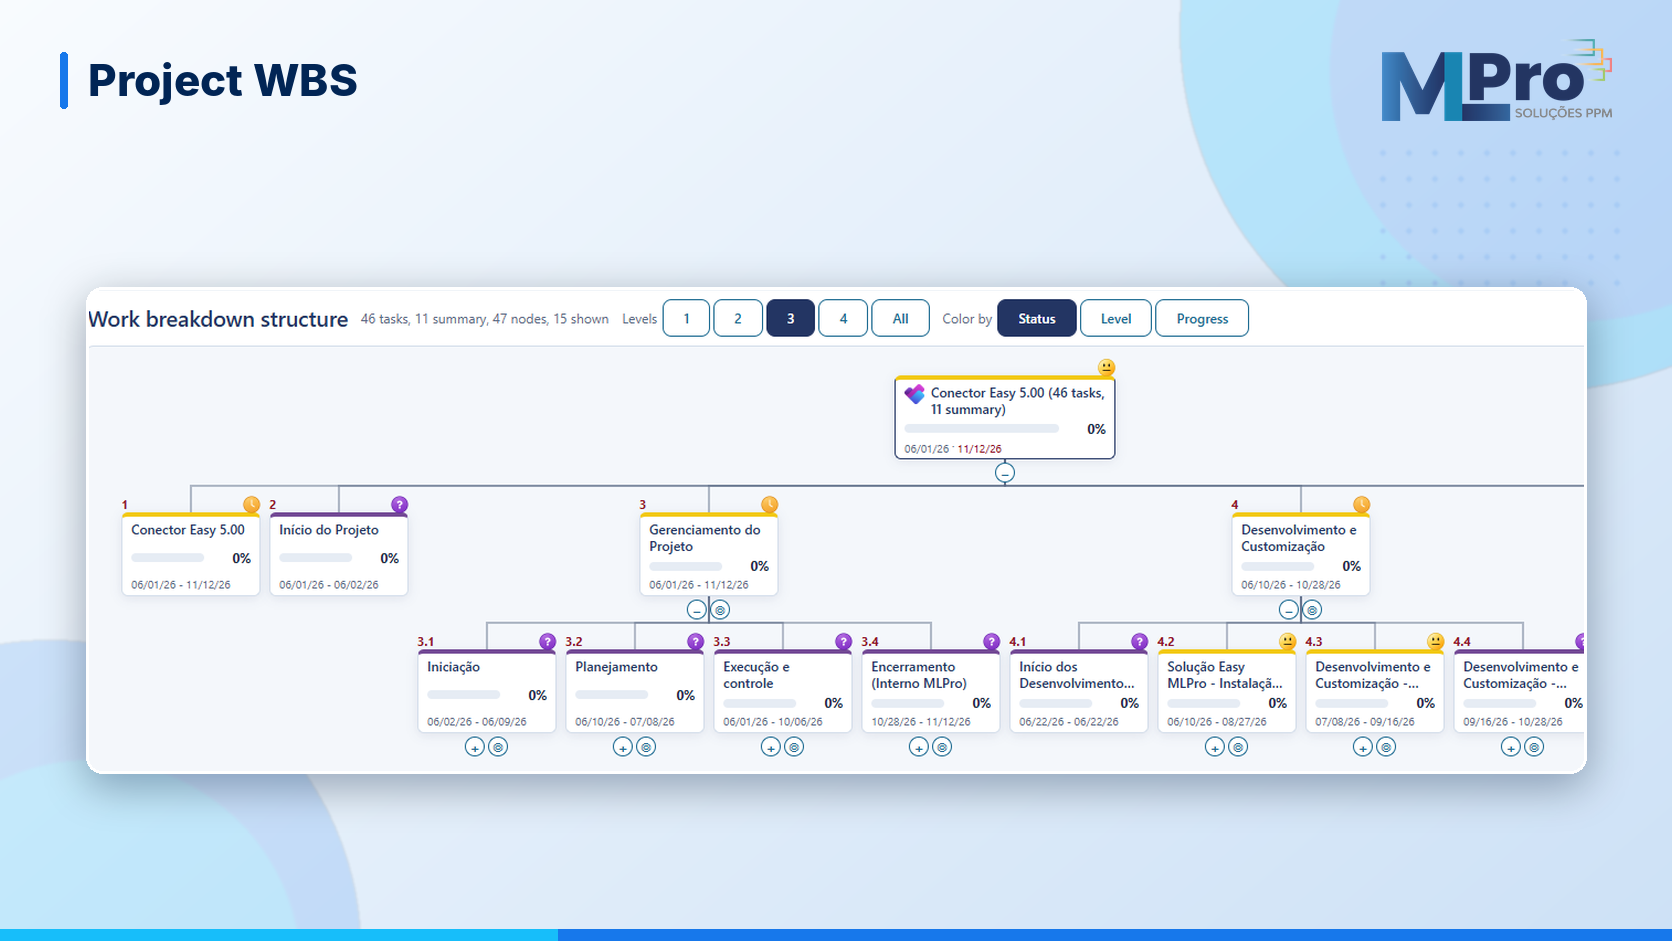
The WBS (work breakdown structure) has been redesigned. You can expand levels, select one or more projects and color the structure by level, status or progress.
Legends explain each symbol, such as the hybrid project icon and the change request status indicator.
ROCI analysis
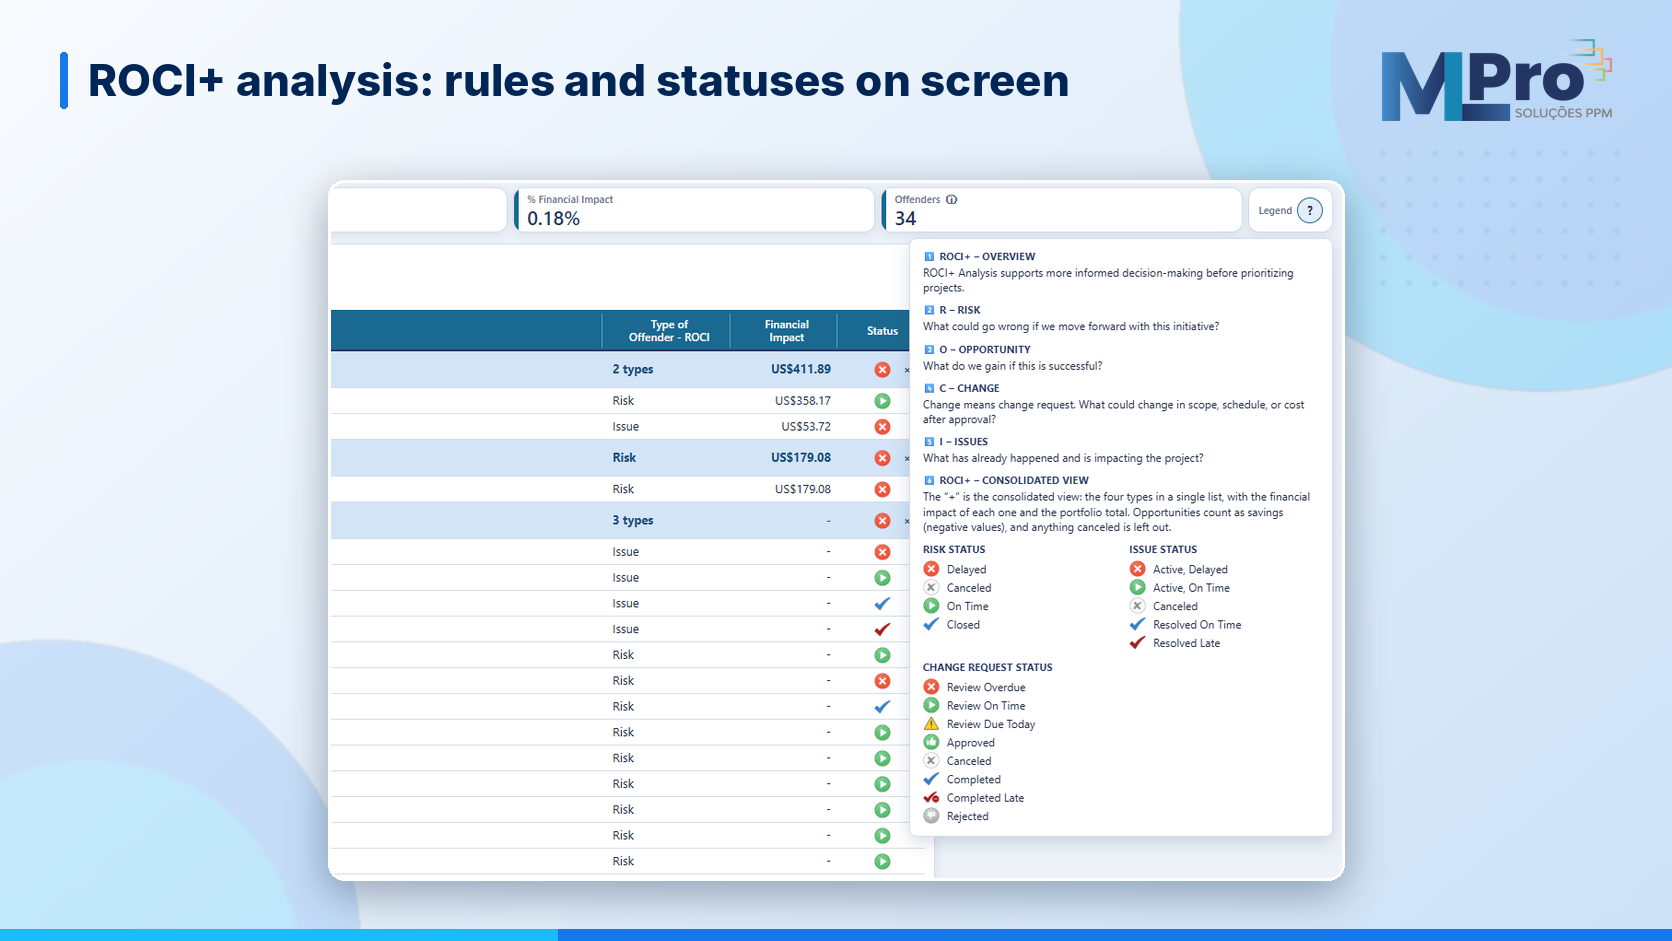
ROCI brings risks, opportunities, changes and issues together in a single view, with the financial impact of each type. The calculation rules and statuses are explained in the report itself, in the help icon. You can expand or collapse groups and spot the worst statuses.
An engine that goes beyond PSA Easy
Advanced reports were built as an engine, not a fixed set of screens. MLPro can add new reports and structures and adjust the information displayed to fit each organization's needs.
The same technology can also be used to build custom reports for other purposes. Integration, data sources and scope are defined in each project.
How to get access
Customers with MLPro support can request implementation of advanced reports using their support hours. Long-standing partners have priority for the first implementations, and new customers can also get access.
Frequently asked questions
Do I need a Power BI license to view advanced reports?
Not to view reports built with MLPro's technology. Requirements for PSA Easy, the platform and each customer's environment still apply.
Are Power BI reports going away?
No. MLPro continues to offer the PSA Easy Power BI reports.
Can I export the reports?
Yes. In the demonstrated version, views can be exported to a print-ready PDF, and working views to Excel.
Can I get reports tailored to my organization?
Yes. The engine supports new reports and structures in PSA Easy and can also be applied to custom reports for other purposes, with scope defined per project.
Continue your journey
- Explore PSA Easy 5.0
- PSA Easy 5.0 after Project Online retires
- PSA Easy: explore the latest improvements
- MLPro on YouTube
About MLPro
For more than 20 years, MLPro has worked with project and portfolio management in the Microsoft ecosystem. MLPro provides implementation, consulting, support and training for Microsoft PPM, Planner Premium, Power Platform, Power BI and PSA Easy.